Call Center Metrics: 14 KPIs Worth Tracking, and What Each One Misses
The call center metrics that matter, with the formula for each: handle time, first call resolution, service level, QA score and more. Plus the part dashboards leave out: why a number moved, which only the calls themselves can tell you.
 Keshav JangidCo-founder, Engineering5 min read

Call center metrics tell you how a floor is performing. They rarely tell you why. Average handle time goes up, first call resolution goes down, and the dashboard cannot say whether the cause is a new product, a broken process or one team that skips a step.
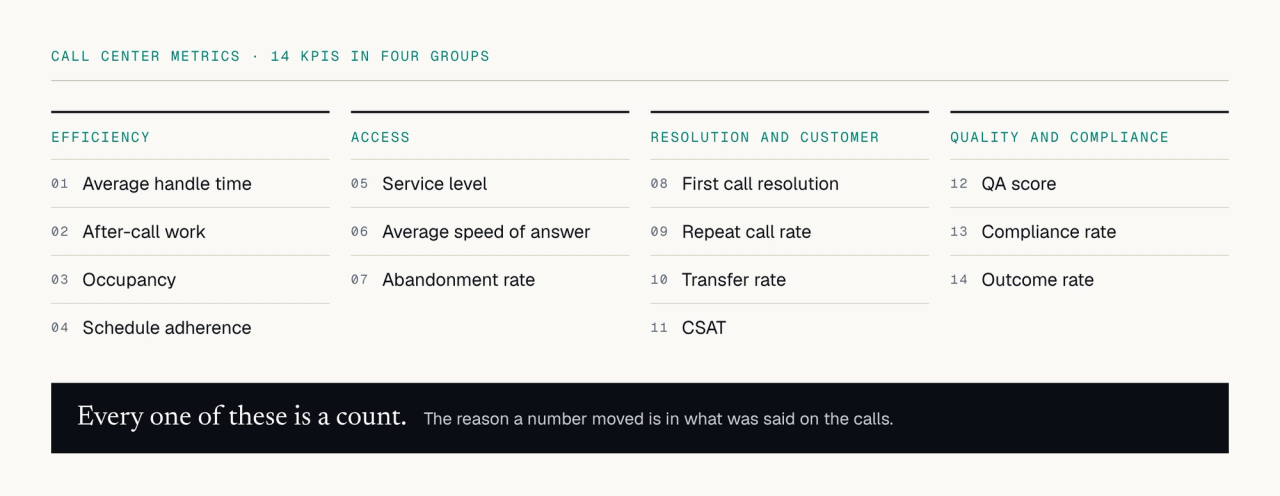
This guide covers the 14 call center KPIs most teams track, how to calculate each one, and what each one misses. The last section covers how to fill that gap from the calls themselves.
Efficiency metrics
1. Average handle time (AHT)
The average time an agent spends on one call, including talk, hold and after-call work.
Formula: (total talk time + total hold time + total after-call work) / calls handled
What it misses: a long call is not always a bad call. AHT rises when agents resolve problems properly and falls when they rush customers off the phone. Read it next to first call resolution, never alone.
2. After-call work (ACW)
The time an agent spends after hanging up: notes, dispositions and CRM updates.
Formula: total after-call work time / calls handled
What it misses: high ACW often means the system makes agents type what was just said. Writing the summary and CRM fields from the call itself is one of the fastest ways to cut it.
3. Occupancy
The share of logged-in time agents spend handling calls or after-call work.
Formula: (talk time + hold time + after-call work) / total logged-in time
What it misses: very high occupancy for long stretches burns agents out and shows up later as attrition and lower quality.
4. Schedule adherence
How closely agents follow their planned schedule.
Formula: time working as scheduled / total scheduled time
What it misses: whether the schedule itself matched the call volume.
Access metrics
5. Service level
The share of calls answered within a target time, such as 80% of calls within 20 seconds.
Formula: calls answered within the target time / total calls offered
6. Average speed of answer (ASA)
Formula: total wait time of answered calls / calls answered
7. Abandonment rate
Formula: calls abandoned before answer / total calls offered
What these miss: all three describe the queue, not the conversation. They tell you callers waited; they cannot tell you why so many people needed to call in the first place.
Resolution and customer metrics
8. First call resolution (FCR)
The share of issues resolved on the first contact, with no repeat call.
Formula: issues resolved on first contact / total issues
What it misses: most teams measure FCR from a disposition code or a survey, both of which are guesses. Reading the calls shows whether the problem was actually solved and why it was not.
9. Repeat call rate
Formula: customers who call again within a set window (often 7 days) / total customers who called
10. Transfer rate
Formula: calls transferred / calls handled
What it misses: whether the transfer was needed. A high rate on one queue usually points to a routing or training gap you can only see in the calls.
11. Customer satisfaction (CSAT)
Formula: satisfied responses (for example 4 or 5 out of 5) / total survey responses
What it misses: survey responses come from a small and skewed share of callers. The calls themselves carry the sentiment of everyone.
Quality and compliance metrics
12. QA score
The average score calls receive against your QA scorecard.
Formula: sum of QA scores / calls scored
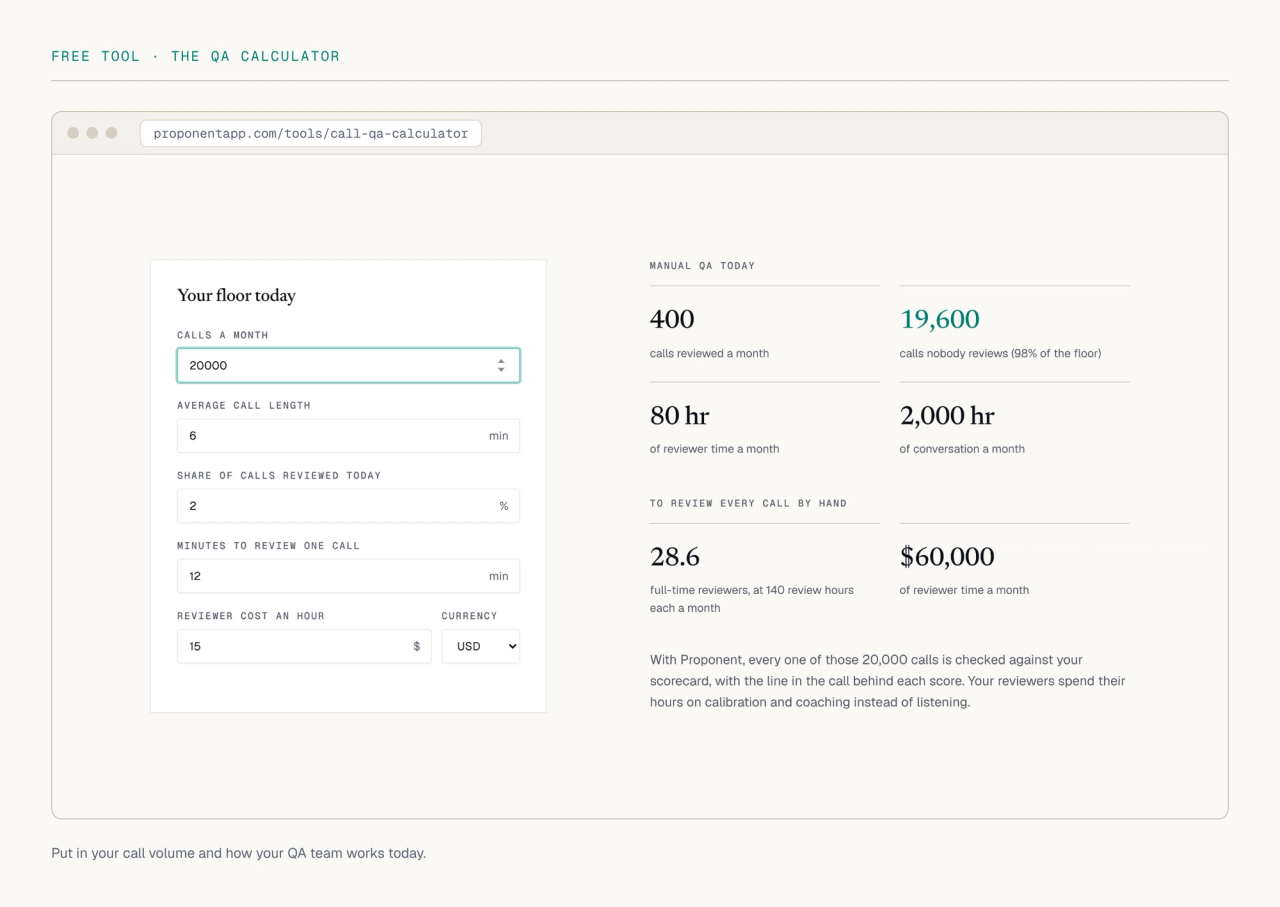
What it misses: in most centers the scored calls are a 2 to 5% sample, picked by hand. A QA score built on a handful of calls per agent tells you little about the agent and nothing about the floor. Use the QA calculator to see how many of your calls nobody reviews today.
13. Compliance rate
The share of calls where every required step was completed: disclosures, identity verification, consent and so on.
Formula: calls passing every compliance check / calls checked
What it misses: a sampled compliance rate is an estimate, and a regulator or client will not accept an estimate after a complaint. Checking every call turns it into a fact.
14. Outcome rate
The share of calls that reach the outcome the call exists for. What that means depends on the call type:
- Sales: conversion rate, sales / calls handled
- Collections: promise-to-pay rate, and the share of promises kept
- Retention: saves / cancellation calls
- Support: resolution, as in FCR above
What call center metrics cannot tell you
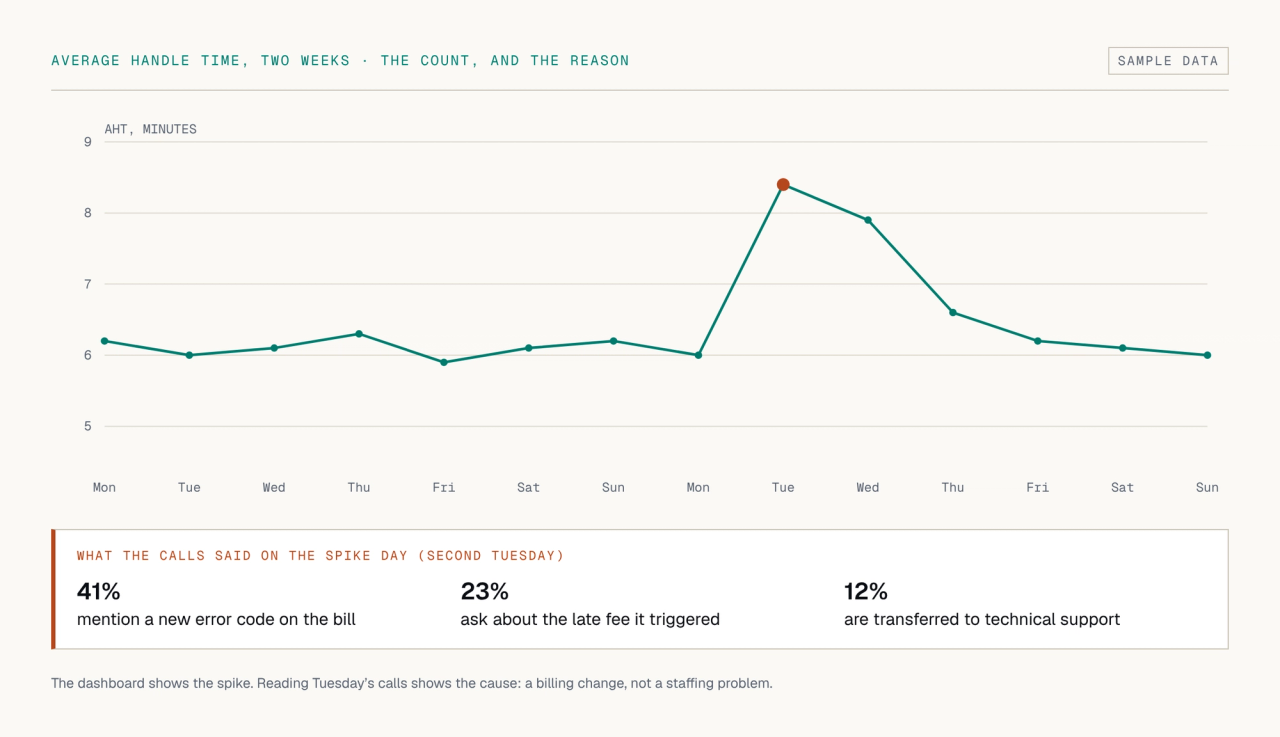
Every metric above is a count. Counts show that something changed; they do not show why. When AHT jumps on a Tuesday, the answer is in what customers said on Tuesday's calls: a new error message, a confusing bill, a policy that changed overnight.
Until recently, finding it meant listening to calls, so most teams listened to a few and guessed. Analyzing every call changes that:
- Every call gets a QA score against your own scorecard, so QA score and compliance rate cover the whole floor, not a sample.
- Reasons become fields. Why customers called, what they objected to and how the call ended become structured data you can chart next to AHT and FCR.
- Each score has evidence. A failed check links to the line in the call, so coaching starts from what was said.
Proponent does this for call centers: every call checked against your scorecard, with results written into the CRM or platform you already run. See AI for call centers or the integrations for your dialer.
Which metrics to start with
If you track nothing else, track these five together:
- First call resolution, because repeat calls are the most expensive calls you take.
- Average handle time, read alongside FCR.
- Service level, because callers who cannot get through do not show up anywhere else.
- QA score across every call, not a sample.
- One outcome rate that matches what your calls are for.
Frequently asked questions
What are the most important call center metrics?
First call resolution, average handle time, service level, QA score and an outcome rate that fits your calls (conversion, promise-to-pay or resolution). Read them together, because each one can be improved at the cost of another.
How do you calculate average handle time?
Add total talk time, total hold time and total after-call work, then divide by the number of calls handled.
How do you calculate first call resolution?
Divide the number of issues resolved on the first contact by the total number of issues. Measure resolution from what happened on the call, or from repeat calls within a set window, rather than from a disposition code alone.
What is the difference between a KPI and a metric in a call center?
A metric is anything you measure, such as abandoned calls. A KPI is a metric you have chosen as a target that reflects your goals, such as first call resolution.
How do you measure call quality?
With a QA scorecard: a list of checks such as greeting, verification, accuracy and resolution, each scored per call. Scoring every call with AI, instead of a small sample, makes the QA score reflect the whole floor.
Get the latest from Proponent Research.
What we learn from analyzing 1M+ calls: QA that covers every call, voice agents that make the routine ones, and the work after the call. One email a month. Leave any time.


